
Australia’s property market: 20 years of change (2006–2026)
Over the past two decades, Australia’s housing market has moved through very different economic conditions: rising interest rates before the global financial crisis, a sharp easing in monetary policy, a long period of relatively low borrowing costs, the COVID-era housing boom and a rapid increase in interest rates from 2022.
Looking at 2006 to 2026 helps put today’s market into context. It also shows why a national headline rarely tells the whole story: property performance differs by city, property type, household circumstances and the timing of a purchase.
At a glance: national estimated dwelling values
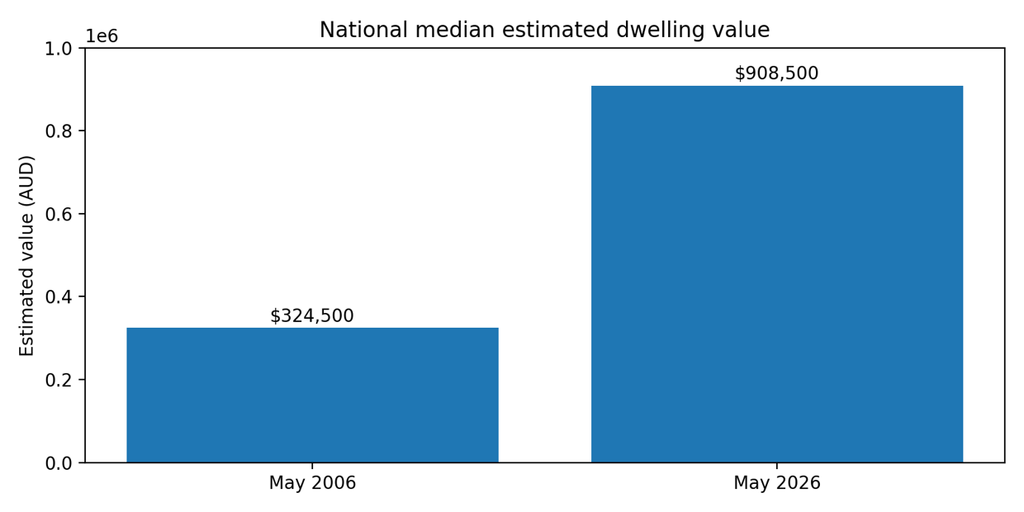
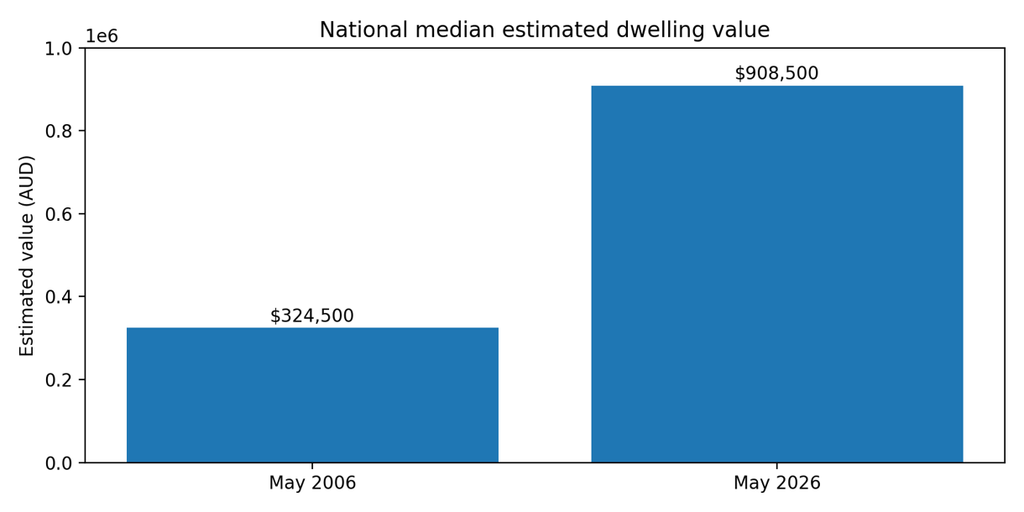
PropTrack’s May 2006 and May 2026 median automated valuation model (AVM) estimates put the national figure at $324,500 and $908,500 respectively. That is an increase of $584,000, or approximately 180% in nominal terms.
Important statistical distinction: These are estimated median residential property values, not actual median sale prices, inflation-adjusted values or the change in value of the same individual properties.
The endpoint comparison is a simple measure of the change between the two published estimates. The realestate.com.au article separately reports a 3.0% average annual rate for the national series; that figure is not the compound annual growth rate implied by the two endpoint values.
How different Australian cities performed
The same PropTrack comparison shows that growth varied considerably between capital-city markets. The table calculates total nominal growth from the May 2006 and May 2026 endpoint estimates.
| Market | May 2006 | May 2026 | Total change |
| Sydney | $417,500 | $1,237,500 | 196% |
| Melbourne | $317,700 | $845,800 | 166% |
| Brisbane | $324,200 | $1,079,800 | 233% |
| Adelaide | $274,600 | $949,800 | 246% |
| Perth | $411,400 | $1,024,100 | 149% |
| Hobart | $249,400 | $734,900 | 195% |
| Darwin | $265,200 | $622,100 | 135% |
| ACT | $357,000 | $869,200 | 143% |
| Australia | $324,500 | $908,500 | 180% |
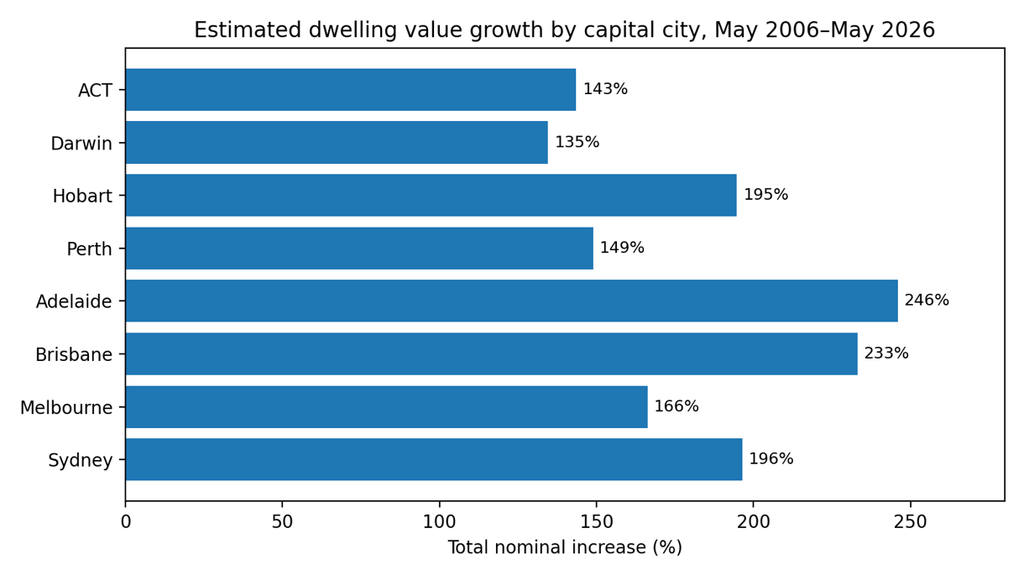
Adelaide and Brisbane recorded the largest percentage increases in this comparison. Sydney remained the most expensive market by estimated value in May 2026, but its percentage increase was lower than several other capitals. The source labels the Canberra-area market as ACT, so that label is retained here.
Source note: PropTrack estimates reproduced by realestate.com.au, published 25 June 2026. Percentage changes calculated from the published endpoint estimates and rounded to the nearest whole percentage point. Figures are nominal and not adjusted for inflation.
The major market and interest-rate cycles
2006–2008: Rising interest rates and affordability pressures
The property market entered this period with relatively high borrowing costs. The Reserve Bank of Australia (RBA) cash rate target rose to 7.25% in March 2008 and remained at that level through August 2008. Inflation pressures and strong domestic demand were important considerations in the RBA’s monetary policy decisions.
2008–2009: The global financial crisis and rapid rate cuts
The global financial crisis (GFC) brought major disruption to global financial markets and changed the economic outlook. The RBA began cutting the cash rate in September 2008. By April 2009, the target had fallen to 3.00%, providing substantial monetary policy support as the global downturn unfolded.
2010–2019: Lower rates and changing market conditions
After the immediate crisis period, the cash rate rose again during 2009–2010 before entering a longer easing cycle. The target eventually reached 0.75% in October 2019. Low borrowing costs over much of this period supported borrowing capacity, although property outcomes differed significantly across cities and years.
2020–2021: COVID-19 and exceptionally low rates
In November 2020, the RBA reduced the cash rate target to 0.10%. The pandemic changed household preferences and economic conditions. Low borrowing costs, policy support and demand for housing contributed to strong price growth in many markets.
2022–2023: Rapid monetary tightening
The RBA began increasing the cash rate in May 2022. The target rose from 0.10% to 4.35% by November 2023. Higher rates increased mortgage repayments for many borrowers and reduced the amount prospective buyers could borrow, placing pressure on purchasing power.
2024–2026: A changing rate environment and a broader correction
The cash rate was reduced to 3.60% in 2025, before increases in 2026 took it to 4.85% effective 4 November 2026. By October 2026, PropTrack’s national home-price measure had fallen for seven consecutive months and was 4.3% below its March peak. The downturn was not uniform: regional markets and units showed greater resilience than combined capital-city markets and houses.
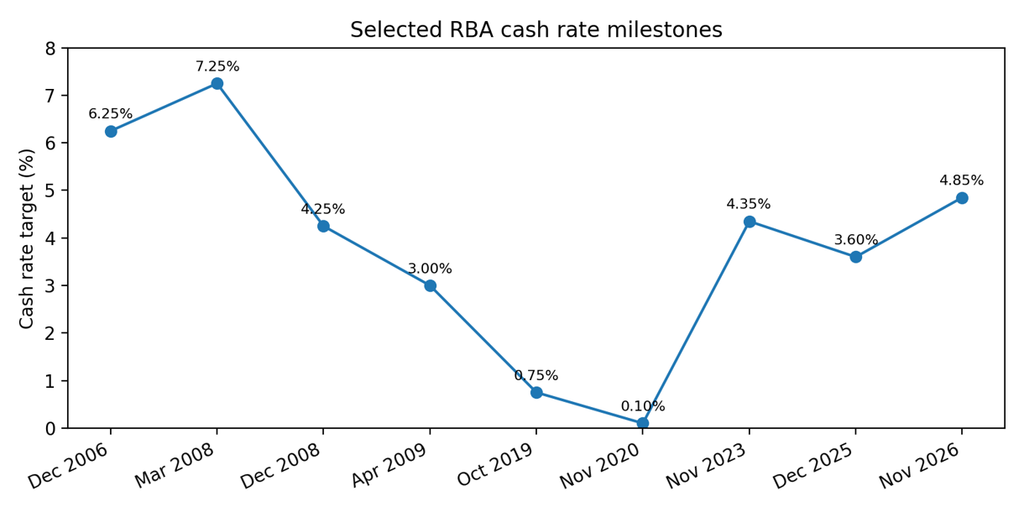
How to read this chart: It shows selected RBA cash-rate milestones, not every monthly decision. The cash rate is a policy benchmark, not the same as an advertised home-loan interest rate.
Housing affordability: more than the purchase price
A higher property price does not tell us on its own how affordable housing is. Household income, mortgage rates, deposit requirements, rents and other living costs all matter. ABS data show that housing costs for owners with a mortgage were 17.4% of gross household income in 2006 and 16.1% in 2023. For private renters, the comparable figures were 17.8% and 19.8%. These are national household averages and should not be interpreted as the experience of every buyer or renter.
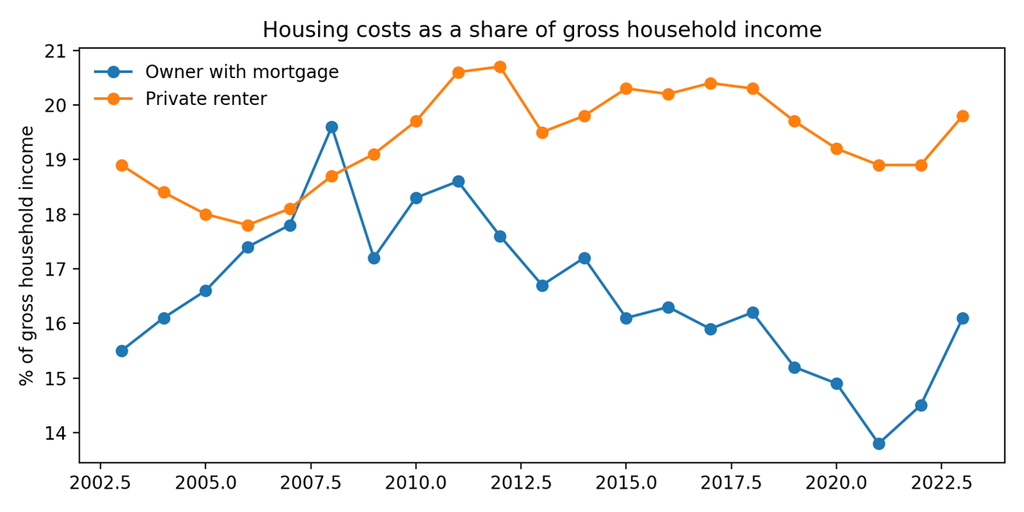
The ABS measure is useful context, but it does not fully capture the deposit barrier faced by first-home buyers, the difference between existing and new borrowers, or the impact of property prices relative to household incomes.
Population growth and housing supply
Australia’s estimated resident population was about 20.7 million at June 2006. By 31 March 2026, it had reached 27.9 million. That is an increase of approximately 35% over the period. Population growth adds to the need for housing, but it is only one part of the picture: where people settle, household size, construction activity, infrastructure, planning and the type of homes being built also influence local supply and demand.
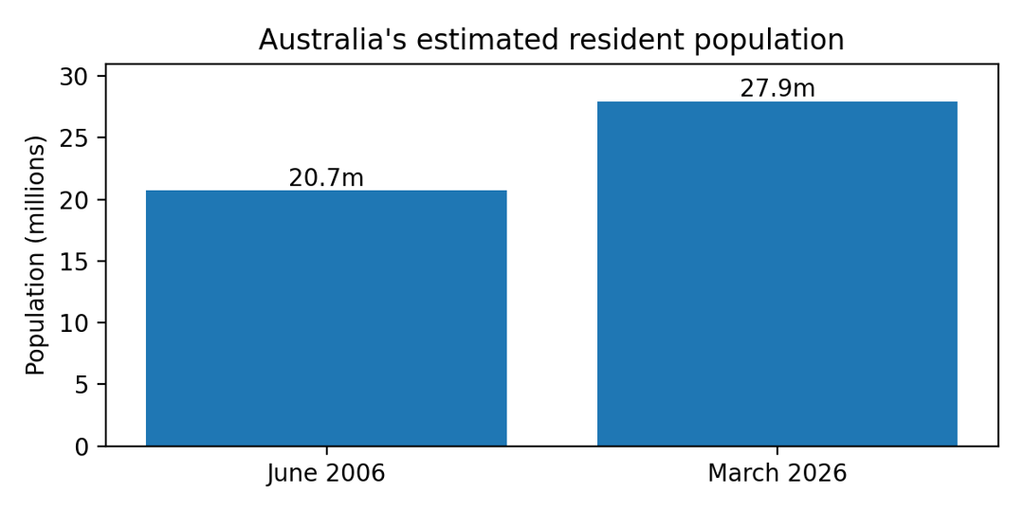
The ABS reported that Australia’s population grew by 392,700 people, or 1.4%, in the year to March 2026. Net overseas migration contributed 292,100 of that increase.
What was happening in the market in October 2026?
The October 2026 realestate.com.au Home Price Report, powered by PropTrack, reported that national home prices fell 0.3% during October. This was the seventh consecutive monthly decline. National prices were 4.3% below their March 2026 peak and 1.9% lower than a year earlier.
| Market | Monthly change | Annual change | Change from peak |
| Australia | -0.3% | -1.9% | -4.3% |
| Combined capitals | -0.3% | -3.7% | -5.4% |
| Regional areas | -0.1% | +3.1% | -1.4% |
The report also showed that Sydney was 6.7% below its peak, Melbourne 6.1%, Brisbane 5.8%, Perth 5.7% and Adelaide 3.4%. Regional markets remained comparatively resilient, while units generally held up better than houses.
Market snapshot date: October 2026 report, first published 2 November 2026. These are index movements, not a prediction of what prices will do next.
What have the last 20 years taught Australian property buyers?
- Property markets move in cycles. Long-term growth has included periods of stagnation, correction and rapid increases. Growth is not guaranteed every year.
- Location matters. National averages can hide large differences between cities, suburbs, property types and regional markets.
- Interest rates affect borrowing capacity. A change in rates can alter repayments and the amount a lender may be willing to lend. The impact depends on the borrower’s circumstances and lender assessment.
- Affordability is about more than price. Deposits, income, repayments, ongoing costs and household cash flow all affect whether a purchase is sustainable.
- Cash flow matters for investors. Rental income should be assessed alongside interest, vacancy, maintenance, insurance, rates, tax and other holding costs.
- A suitable decision is personal. The right timing and property choice depend on goals, financial position, risk tolerance and the ability to manage repayments.
What does this mean for buyers, homeowners and investors?
For first-home buyers, the starting point is understanding a realistic budget, deposit position and borrowing capacity before committing to a property search. For existing homeowners, it may be worth reviewing the loan structure, interest rate, fees, offset arrangements and whether the current loan still suits their needs. For investors, the decision should consider rental demand, cash flow, costs, location and the longer-term strategy—not just expected capital growth.
There is no single perfect time to buy that applies to everyone. A property purchase should make sense for the household’s finances and plans, not simply because headlines suggest prices may rise or fall.
Looking ahead: making informed property decisions
The last 20 years show that Australia’s property market is shaped by many forces: interest rates, household incomes, population change, housing supply, economic conditions and buyer confidence. Historical data can help explain what has happened, but it cannot guarantee what will happen next.
At Excel Finance Choice, we believe a home loan should be about more than finding an interest rate. It should be about understanding the numbers, your circumstances and the person behind them. Whether you are buying your first home, upgrading, refinancing or considering an investment, understanding your financial position is an important first step.
References and further reading
1. PropTrack / realestate.com.au (25 June 2026). “Aussie home prices double roughly every 10 years, but should they?” May 2006 and May 2026 median AVM estimates by market. View source
2. Reserve Bank of Australia. “Cash Rate Target.” Historical cash-rate target decisions, including the November 2026 decision. View source
3. Reserve Bank of Australia. “The Global Financial Crisis.” Background on the GFC and Australian policy response. View source
4. Australian Bureau of Statistics (15 September 2025). “Housing serviceability.” Housing costs as a proportion of gross household income by tenure type, 2003–2023. View source
5. Australian Bureau of Statistics (17 September 2026). “Australia’s population grows 1.4% in March 2026.” View source
6. Australian Bureau of Statistics. “Year Book Australia, 2008 – Population size and growth.” Estimated resident population at 30 June 2006. View source
7. realestate.com.au / PropTrack (2 November 2026). “realestate.com.au Home Price Report – October 2026.” View source
Data notes and disclaimer
Property values: PropTrack median AVM estimates are modelled estimates of residential property values based on sales and other data. They are not actual median sale prices and do not track the same individual properties through time.
Growth calculations: Total percentage changes in the city comparison are calculated as (May 2026 estimate ÷ May 2006 estimate − 1) × 100 and rounded to the nearest whole percentage point. Dollar values are nominal and have not been adjusted for inflation.
Interest rates: The RBA cash rate target is a monetary policy benchmark. It is not a home-loan rate, and changes in the cash rate are not necessarily passed on in full or immediately by every lender.
Disclaimer: This article is general information only and is not personal financial, credit or property investment advice. Historical performance is not a reliable indicator of future performance. Property values and market conditions vary by location and individual circumstances. Readers should consider their own objectives and circumstances and obtain appropriate professional advice before making financial decisions.